Sunrise and Sunset
![]()
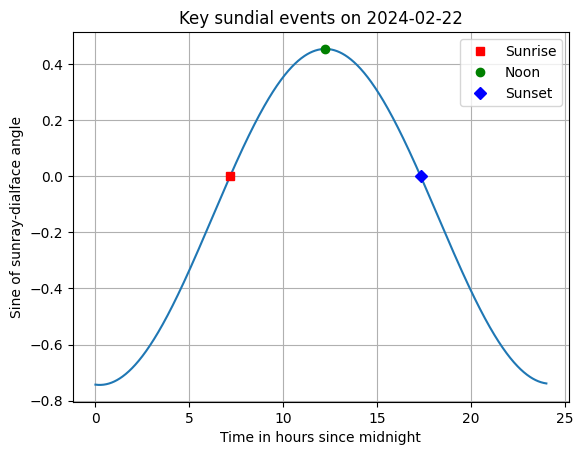
To plot analemmas, we need to know the range of time within each day to plot the path of the tip of the shadow as the sun moves through the sky. This is determined by the angle between the sun ray and the face of the dial. When the sun ray and dial face are parallel, we have an effective sunrise or sunset relative to the dial. When the sun ray is closest to perpendicular to the dial face, we have an effective noon relative to the dial. For some dials on some days, such points do not exist and there is either a shadow throughout the entire day or the lack thereof.
from analemma import geometry as geom, orbit, plot as aplot
import matplotlib.pyplot as plt
import numpy as np
A Single Day
Sunrise and sunset on an arbitrary day in Cambridge, UK
fig, ax = plt.subplots()

pi = np.pi
earth = orbit.PlanetParameters.earth()
camdial = geom.DialParameters(theta=37.5/180*pi, iota=37.5/180*pi, i=0, d=0) # Analemmatic dial in Cambridge, UK

aplot.plot_sunrise_sunset(ax, orbit.orbit_day_to_date(50), earth, camdial)
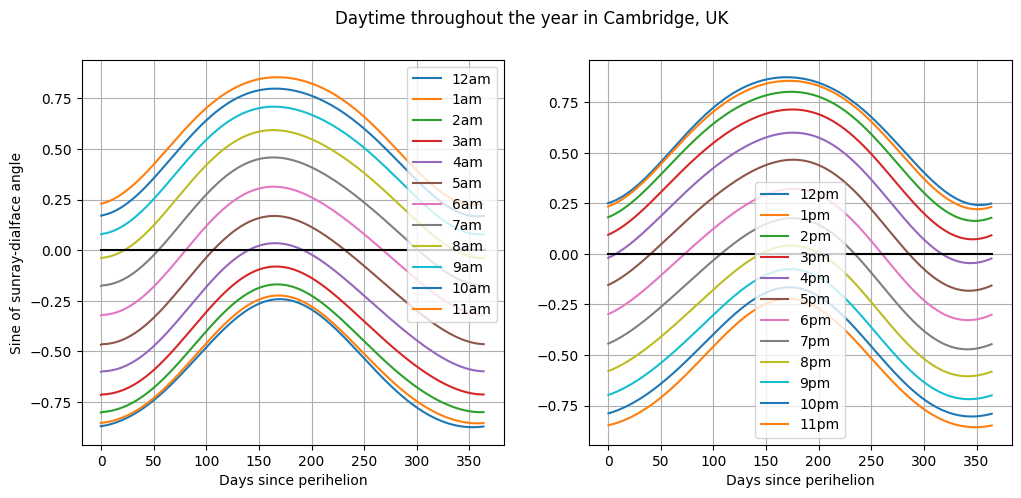
Daytime in Cambridge, UK
An effective daytime relative to the dial exists when the sine of the sunray-dialface angle is positive.
fig, ax = plt.subplots(1, 2, figsize=(12, 5))

aplot.plot_annual_sunray_dialface_angle(ax[0], ax[1], earth, camdial)
_ = fig.suptitle("Daytime throughout the year in Cambridge, UK")
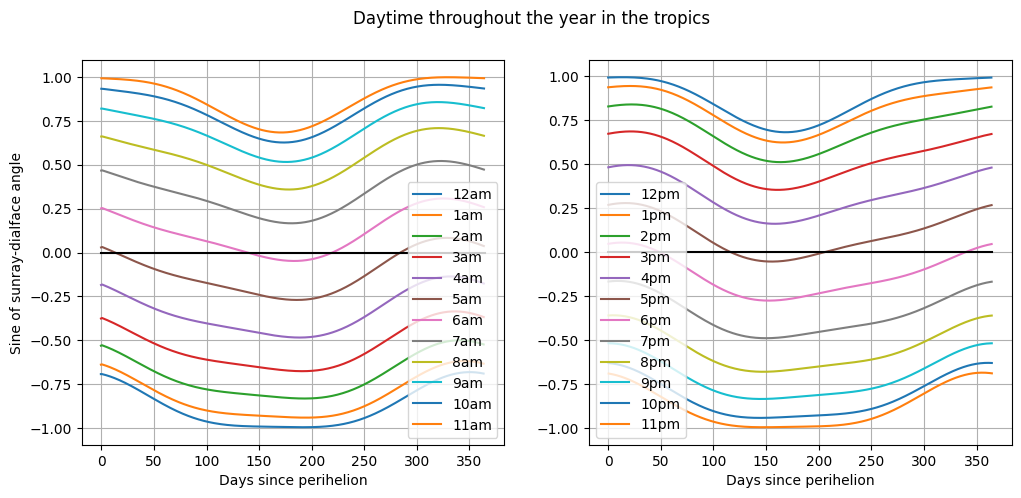
Daytime in the Tropics
At a latitude of \(10^\circ\) South the curves are flatter, reflecting a reduced varation in the time of sunset and sunrise over the year.
tropicaldial = geom.DialParameters(theta=100/180*pi, iota=20/180*pi, i=-15/180*pi, d=30/180*pi)

fig, ax = plt.subplots(1, 2, figsize=(12, 5))
aplot.plot_annual_sunray_dialface_angle(ax[0], ax[1], earth, tropicaldial)
_ = fig.suptitle("Daytime throughout the year in the tropics")
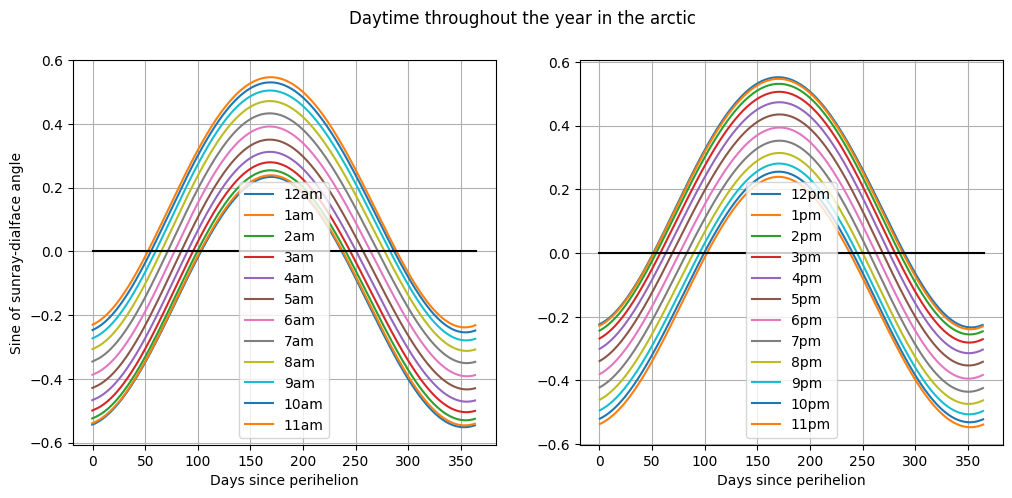
Days and Nights in the Arctic
At a latitude of \(80^\circ\) North, sunrise and sunset is only observed at times of year close to the equinoxes, reflecting approximately six months of 24-hour daylight in the Summer and 24-hour darkness in the Winter.
arcticdial = geom.DialParameters(theta=10/180*pi, iota=0, i=0, d=30/180*pi)

fig, ax = plt.subplots(1, 2, figsize=(12, 5))
aplot.plot_annual_sunray_dialface_angle(ax[0], ax[1], earth, arcticdial)
_ = fig.suptitle("Daytime throughout the year in the arctic")
These results are based on orbital dynamics analyzed in detail in Orbit Analysis.